If you have spent any time in the Project NOMAD community, you have seen people throw around scores like 75 or 87. But what does a NOMAD Benchmark Score actually measure, why does it matter, and what kind of score should you expect from different hardware configurations?
This page answers all of that, using real data from the community leaderboard and the official Project NOMAD documentation.
The Short Version
The NOMAD Score is a single number that tells you how capable your hardware is at running Project NOMAD, specifically the AI components. It is calculated from a weighted composite of four measurements: CPU performance, memory performance, disk performance, and AI inference speed.
The AI component carries the most weight. A system running an AI model on a GPU will almost always outscore one running the same model on CPU alone, even if the CPU-only machine has better raw processing specs in every other category.
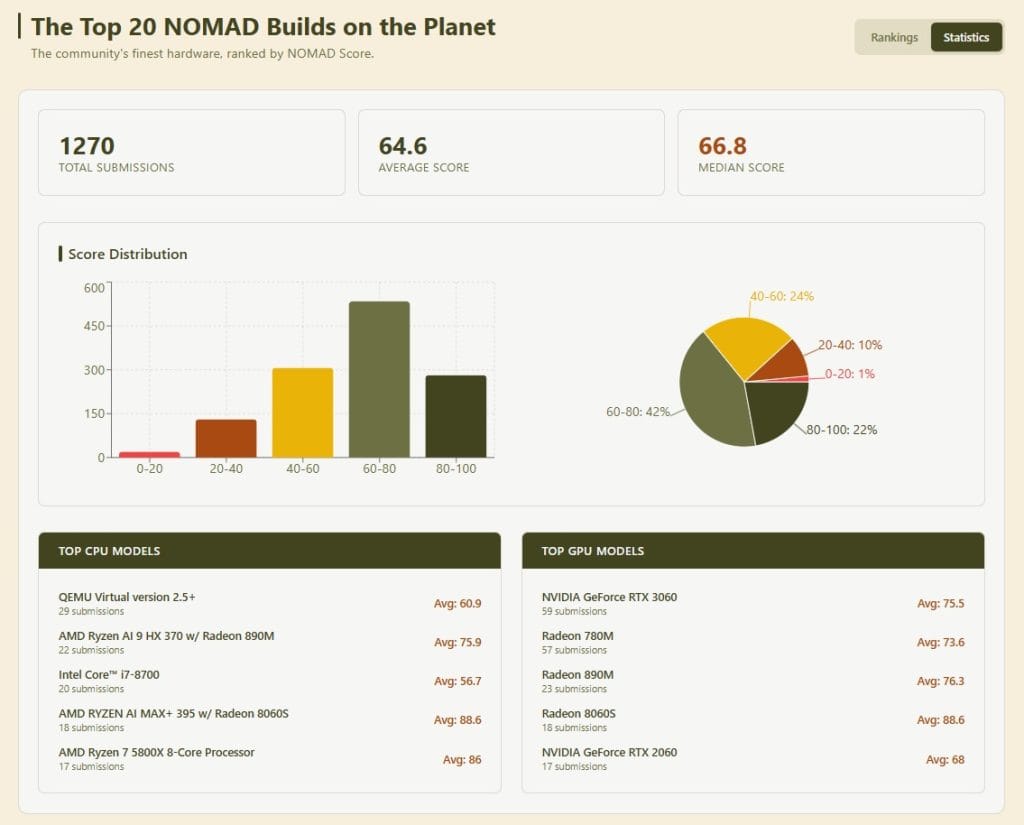
Scores across the community range from the single digits on underpowered hardware up through the top of the scale on well-configured GPU builds. With 1,270 submitted results, the current community average sits at 64.6, with a median of 66.8. The largest single group – 42% of all builds – lands in the 60 – 80 range, with another 22% in the 80 – 100 range.
How the Nomad Benchmark Score Is Calculated
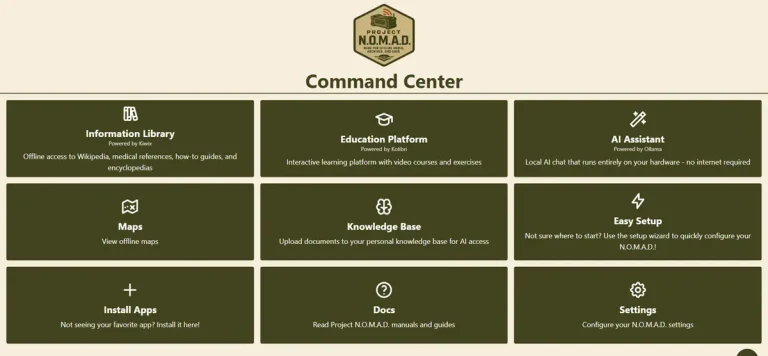
Project NOMAD runs its benchmark from inside the Command Center management interface. You go to Settings, choose System Benchmark, and select one of three test types.
Full Benchmark tests all four categories – CPU, memory, disk, and AI inference. This is the only type that can be submitted to the public leaderboard, and the AI Assistant must be installed and working for the result to count.
System Only tests CPU, memory, and disk performance without touching AI inference. Useful if you want to understand your hardware baseline before installing the AI module, but the score cannot be submitted publicly.
AI Only tests inference performance in isolation. Again, not submittable to the leaderboard.
One practical implication: if your AI Assistant is not installed or not functioning correctly, you cannot get a leaderboard-eligible score. The full score requires the full stack to be running.
The benchmark runs in the background and takes a few minutes to complete. The documentation is specific about one thing: do not shut down or restart the server while it is running.
What the Score Ranges Actually Mean
Here is how real-world hardware maps to score ranges, based on official NOMAD hardware recommendations and community leaderboard data.
Score 15 – 40: Budget and Refurbished Hardware
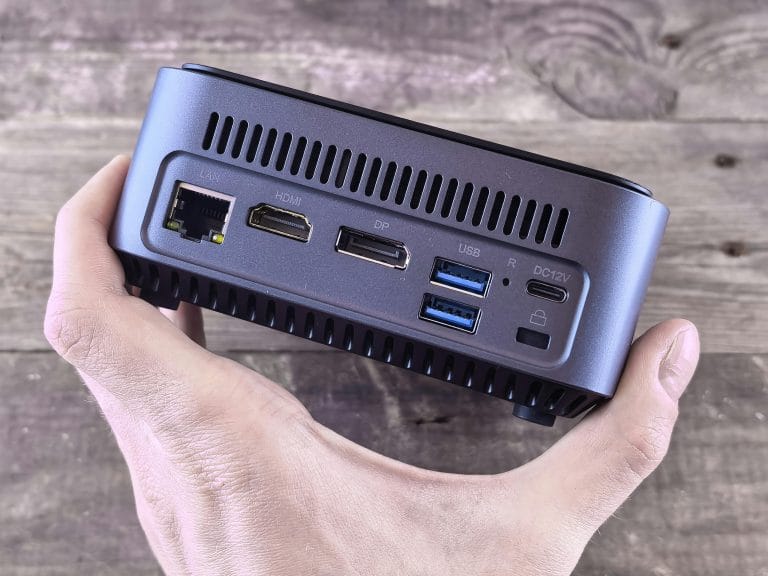
This range covers older desktop PCs, corporate lease returns, and machines running integrated Intel graphics. Think Dell OptiPlex Micro, Lenovo ThinkCentre Tiny, HP EliteDesk Mini – the kind of hardware that sells for $150 to $300 refurbished.
These systems can run Project NOMAD well for offline knowledge access, Wikipedia, maps, and the education modules. AI performance is limited to smaller 1 – 3 billion parameter models, running at roughly 5 to 20 tokens per second. That is functional for basic Q&A but noticeably slow for anything conversational.
Score 75 – 90: AMD Radeon iGPU Builds
This is where things get genuinely capable. Hardware in this range typically runs an AMD Ryzen 7 or Ryzen 9 processor with integrated Radeon graphics – the 780M, 890M, or newer 8060S. These chips handle AI workloads without a discrete GPU card, and the leaderboard data backs it up. Across 57 submissions, the Radeon 780M averages a score of 73.6. The Radeon 890M averages 76.3 across 23 submissions. The newer Radeon 8060S, found in Ryzen AI MAX+ 395 builds, averages 88.6 across 18 submissions.
Community-tested results from the Project NOMAD hardware page show the Minisforum AI X1 Pro (Ryzen AI 9 HX 370 with Radeon 890M) scoring 87 at 51.7 tokens per second, and the UM890 Pro (Ryzen 9 PRO 8945HS with Radeon 780M) scoring 75 at 57.2 tokens per second.
At this level, 3 to 8 billion parameter models run with responsive, conversational performance. This is the range most people should be targeting if they want a genuinely useful offline AI system.
Score 85 – 100: Discrete GPU Builds
Adding a dedicated NVIDIA GPU changes the numbers dramatically. The official documentation notes that GPU-accelerated builds typically reach 100+ tokens per second compared to 10 – 15 on CPU-only hardware. The Minisforum MS-02 Ultra, tested by the Project NOMAD team with an RTX 5060, scores 90.1 and hits 281.5 tokens per second. The leaderboard top end continues to climb as more GPU builds are submitted.
Why AI Inference Speed Dominates the Score
The benchmark is weighted the way it is for a good reason. Wikipedia, maps, and the education modules load from local storage and run fine on almost any modern hardware. The bottleneck for most people is AI performance – how fast the system can respond to queries, how capable the models it can run are, and whether conversations feel fluid or like watching text arrive one word at a time.
A system that runs offline knowledge at full speed but handles AI at 8 tokens per second is less useful than one that does both well. The scoring reflects that priority.
This is also why two machines with similar CPU specs can land in completely different score ranges depending on their GPU situation. CPU performance matters, but it is rarely the limiting factor in a NOMAD build. The AI inference layer is.
The Community Leaderboard
Verified benchmark results can be submitted to the public leaderboard at benchmark.projectnomad.us. Results are displayed with a “Builder Tag” – a randomly formatted identity in the style of Tactical-Llama-1234 – rather than usernames or real names. With over 1,270 community submissions, it is the most comprehensive public database of real NOMAD hardware performance that exists.
To submit a result, three conditions have to be met: the benchmark must be a Full Benchmark, the AI Assistant must be installed and working, and the new score must be higher than any previous submission from the same hardware. You can re-benchmark after hardware upgrades and submit the improved result. Full documentation on the benchmark process is available in the official Project NOMAD docs.
Measuring the Impact of a GPU Upgrade
One of the most practical uses of the benchmark tool is quantifying what a hardware upgrade actually does to your system. The official documentation recommends running a Full Benchmark before adding a GPU, then running another after installing the GPU and completing the AI Assistant Force Reinstall process.
The before/after comparison gives you a concrete measurement of what the upgrade delivered – not a theoretical spec sheet number, but your actual hardware running the actual workload.
This is worth doing if you are considering adding an eGPU to an existing mini PC setup or upgrading from integrated to discrete graphics. The benchmark tells you exactly where you started and where you landed.
What This Means for a Pre-Built Codex Unit
Every Personal Codex appliance ships pre-configured with Project NOMAD installed and benchmarked. The estimated NOMAD Score ranges for each tier reflect the hardware category each unit is built from.
The Codex Essential, built on refurbished enterprise hardware with integrated Intel graphics, falls in the 15 – 40 estimated range. Capable for offline knowledge access and basic AI queries with smaller models.
The Codex Standard, built on an AMD Ryzen 7 Zen 4 platform with Radeon 780M or 890M integrated graphics, targets the 80 – 95 range. This matches the most popular hardware category on the community leaderboard and delivers 30 – 55 tokens per second in practice.
The Codex Power, built around an NVIDIA RTX 5070 or better, targets the 85 – 100 range with discrete GPU acceleration and speeds above 200 tokens per second.
These are estimated ranges based on the hardware categories, not guaranteed scores for specific units. Actual benchmark results for completed builds will be posted here as units are assembled and tested.
Running the Benchmark Yourself
If you are running Project NOMAD on your own hardware, the benchmark is built in. Open the Command Center, go to Settings, and navigate to System Benchmark. Run a Full Benchmark with the AI Assistant installed to get a leaderboard-eligible score.
If you want to understand your hardware baseline before setting up AI, the System Only benchmark gives you CPU, memory, and disk measurements without requiring the full AI stack.
The tool is genuinely useful for understanding what your hardware can do and for making decisions about whether an upgrade is worth the cost. The community leaderboard at benchmark.projectnomad.us gives you real comparison data from actual NOMAD installations, which is more useful than synthetic benchmarks run outside the platform context.
Closing Note
The NOMAD Score is not a marketing number or an abstract rating. It is a measurement your hardware produces by actually running the workloads Project NOMAD uses – and the AI inference component, which carries the most weight, is tested with Ollama running a real model on your actual GPU or CPU configuration.
If you are evaluating hardware for a NOMAD build – whether you are putting one together yourself or looking at a pre-configured unit – the score gives you a meaningful, comparable data point. A score in the 80s tells you something specific about what that hardware can do, because it was produced by running the same benchmark on the same stack.
That is what makes it worth paying attention to.
Ready to see what a pre-configured Codex appliance scores? View the Codex Standard – the hardware tier that targets the 80 – 95 range.